AQA A-Level · Topic 3.8
Prerequisite knowledge: atomic structure (protons, neutrons, electrons, charge); Coulomb's law / electric force; kinetic energy (½mv²); properties of ionising radiation
In 1909, Geiger and Marsden (working with Rutherford) fired alpha particles at thin gold foil inside an evacuated chamber. A zinc sulphide screen emitted light on impact, detected by a moving microscope in a dark room.
The accepted model at the time was Thomson's plum pudding model: a diffuse positive charge with electrons embedded throughout.
Results:
Why vacuum? Alpha particles have a range of only ~5 cm in air — they would be absorbed before reaching the foil.
Why thin gold foil? To avoid multiple scattering events, so each deflection comes from a single nucleus.
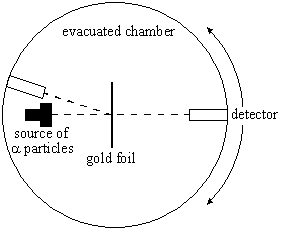
Fig 1.1 — Rutherford scattering apparatus
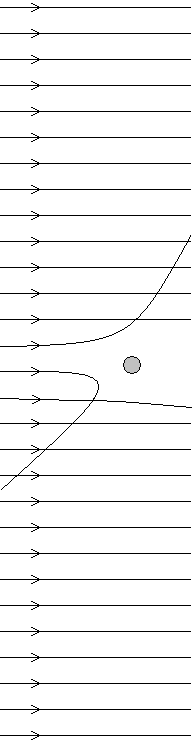
Fig 1.2 — Alpha particle scattering paths
Rutherford used the scattering results to propose the nuclear model:
Upper limit on nuclear radius — distance of closest approach, when all KE converts to electric PE:
Typical nuclear diameter: ~10−14 m | Typical atom diameter: ~10−10 m (nucleus is ~10,000× smaller)
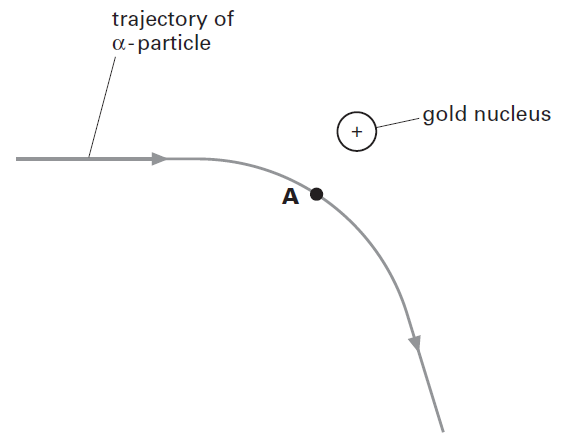
Fig 1.3 — Alpha particle trajectory past a gold nucleus
Different particles reveal different structural information. For diffraction to reveal structure, the wavelength must be comparable to or smaller than the feature being studied.
de Broglie wavelength (relativistic / high-energy electrons):
Diffraction minimum (first minimum gives nuclear diameter D):
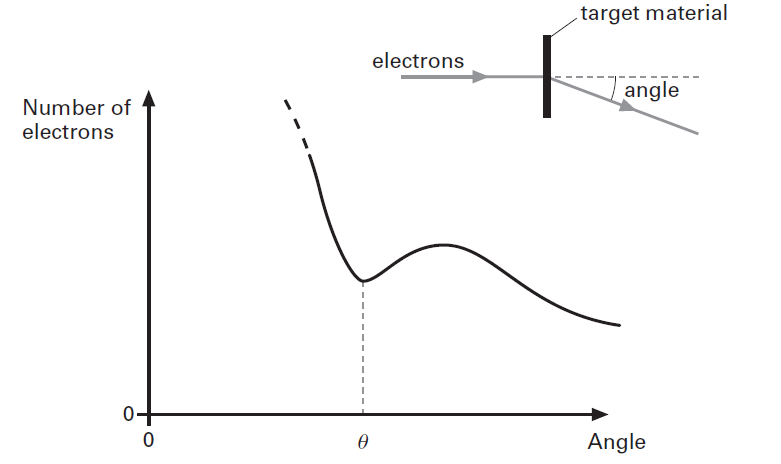
Fig 1.4 — Electron diffraction pattern
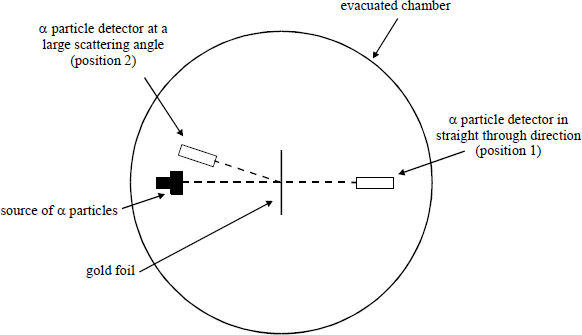
Fig 1.5 — Rutherford scattering apparatus (exam diagram)
Prerequisite knowledge: composition and properties of α, β, and γ radiation; electromagnetic spectrum; electric deflection of charged particles
Ionisation is the removal of electrons from atoms. Radiation entering a GM tube ionises the gas inside; electrons travel to the positive wire, producing a detectable current.
| Property | Alpha (α) | Beta-minus (β⁻) |
|---|---|---|
| Composition | Helium nucleus (2p + 2n) | Fast electron (from n→p) |
| Relative mass | 4 | 1/2000 |
| Relative charge | +2 | −1 |
| Deflection by E/M | Yes (towards −ve plate) | Yes (towards +ve plate) |
| Ionising power | High | Medium |
| Range in air | ~5 cm | 2–3 m |
| Stopped by | Skin / paper | ~3 mm aluminium |
| Inside body risk | Very high — cell death/mutation | Moderate |
| Property | Gamma (γ) |
|---|---|
| Nature | High-frequency electromagnetic wave |
| Relative mass / charge | 0 / 0 |
| Deflection by E/M | No |
| Ionising power | Low |
| Penetrating power | Very high |
| Stopped by | Lead / thick concrete (reduces, never stops completely) |
| Uses | Medical/industrial tracers; sterilising surgical equipment |
Inverse Square Law — gamma from a point source spreads isotropically (equal intensity in all directions):
Background radiation must always be subtracted from measured count rates to obtain the corrected count rate due to the source.
UK background sources (approx.): Radon/Thoron 51% · Ground/rocks 14% · Food/drink 12% · Medical 12% · Cosmic rays 10% · Other <1%
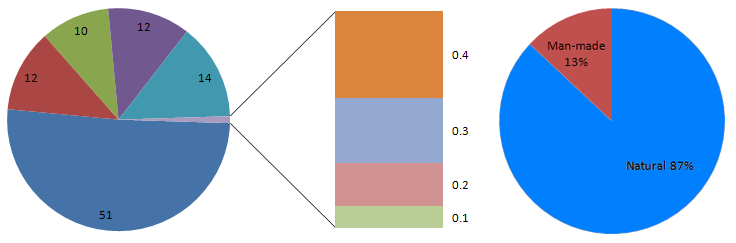
Fig 2.1 — Sources of background radiation in the UK
The danger from radiation depends on type, dose, and whether the source is inside or outside the body.
Gamma sterilisation of surgical instruments: Gamma rays penetrate packaging and kill micro-organisms. They do not make instruments radioactive — the gamma photons are absorbed and leave no residual radioactivity.
Checking for beta emission: Place ~3 mm of aluminium between source and detector. A significant drop in count rate (beyond that expected from gamma alone) indicates beta is also present.
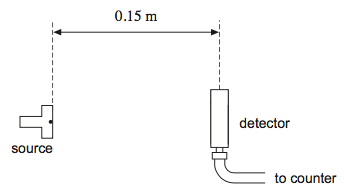
Fig 2.2 — Gamma source and detector arrangement
Prerequisite knowledge: exponential functions; natural logarithm (ln); unit conversions for time; concept of half-life from GCSE
Radioactive decay is random (cannot predict which nucleus decays next) and spontaneous (unaffected by temperature, pressure, or chemical state).
Decay constant λ — the probability that a given nucleus decays per unit time. Unique to each isotope. Units: s⁻¹
Activity A — number of nuclear decays per second. 1 Becquerel (Bq) = 1 decay per second.
The minus sign indicates N (number of undecayed nuclei) is decreasing. Activity decreases continuously as undecayed nuclei are used up.
Half-life T½ — the time taken for the number of undecayed nuclei (or the activity) to fall to half its initial value.
Exponential decay equations:
Reading T½ from a graph: Choose any starting value; find the time for it to fall to half — that is T½. Repeat from a different starting point for reliability.
Linearising: Take ln of both sides: ln A = ln A₀ − λt. A graph of ln A vs t gives a straight line with gradient −λ.
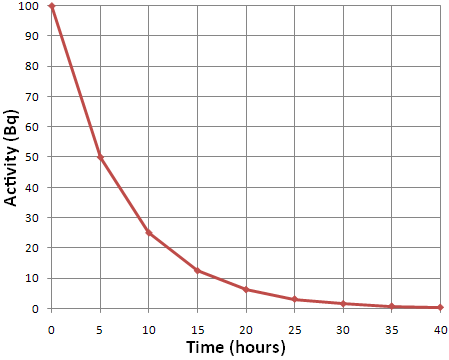
Fig 3.1 — Activity vs time
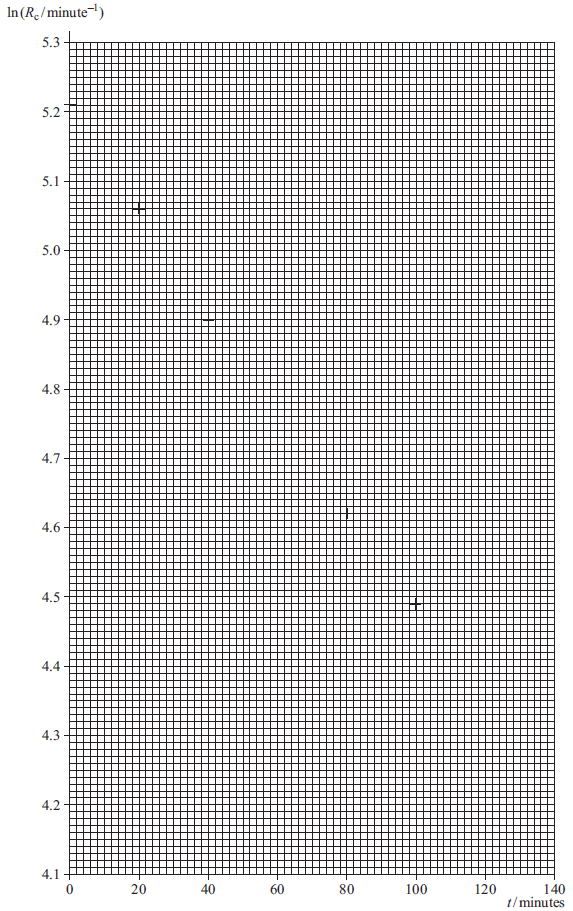
Fig 3.2 — ln(activity) vs time
Carbon dating: Living wood continuously exchanges carbon with the atmosphere, maintaining a constant ratio of ¹⁴C to ¹²C (1 in 10¹²). Once wood is cut, ¹⁴C decays without replacement. The age is found from:
Limitations: Assumes constant atmospheric ¹⁴C ratio; very low activity gives large statistical uncertainty; contamination affects results.
Medical tracers (e.g. Tc-99m) are injected and detected externally by gamma cameras. Requirements:
Prerequisite knowledge: nuclear notation (AZX); conservation of nucleon and proton number; types of decay and particles emitted; antineutrinos
The N–Z graph (neutron number vs proton number) shows the region of nuclear stability — the 'valley of stability'.
Why more neutrons in heavy nuclei? Protons repel each other electrostatically. The strong nuclear force acts only at very short range (~1–3 fm). As Z increases, distant protons only feel Coulomb repulsion. Extra neutrons provide strong-force binding without adding electrostatic repulsion.
Position on the N–Z graph predicts decay mode:
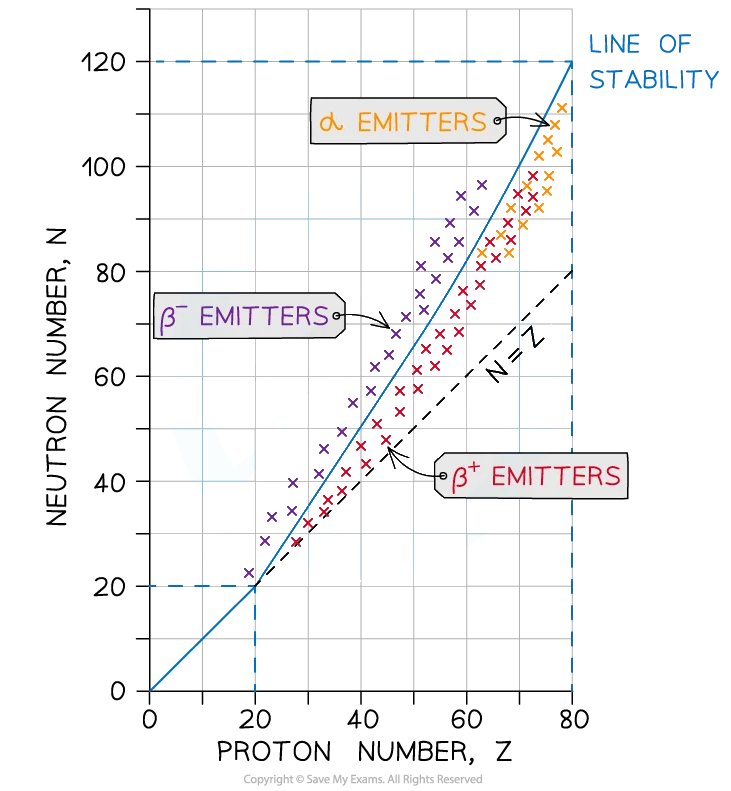
Fig 4.1 — N–Z stability graph (valley of stability)
Alpha (α) Decay — ejects a helium-4 nucleus:
Loss: 2 protons, 2 neutrons. Moves the nuclide 2 left and 2 down on the N–Z graph.
Beta-minus (β⁻) Decay — a neutron transforms into a proton:
Loss: 1 neutron; Gain: 1 proton. Also emits an electron antineutrino. Moves nuclide 1 right, 1 down.
Beta-plus (β⁺) Decay — a proton transforms into a neutron:
Loss: 1 proton; Gain: 1 neutron. Also emits an electron neutrino. Moves nuclide 1 left, 1 up.
Gamma (γ) emission — follows alpha or beta decay. The daughter nucleus is in an excited state and releases excess energy as a gamma photon. No change to Z or A.
Electron Capture: A proton-rich nucleus captures one of its own orbital electrons. The proton and electron combine to form a neutron and an electron neutrino:
Effect: proton number decreases by 1, nucleon number unchanged. Same effect on N–Z graph as β⁺ decay.
Nucleon Emission (rare):
Decay chains: Heavy radioactive isotopes often undergo a series of alpha and beta decays before reaching a stable end-product. The decay sequence can be tracked on the N–Z graph.
Iodine-131 (treats overactive thyroid): decays by β⁻ to xenon, which then emits γ rays.
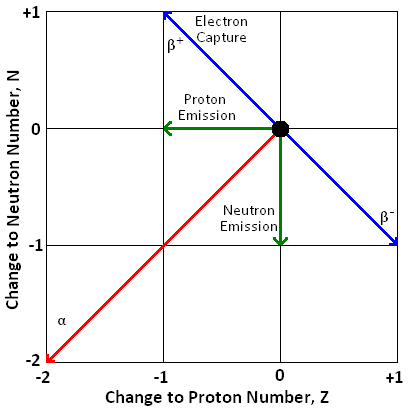
Fig 4.2 — Effect of each decay mode on proton/neutron numbers
Prerequisite knowledge: electric potential energy (Coulomb's law); energy unit conversions (eV, MeV, J); de Broglie wavelength (λ = h/p); conditions for diffraction
When an alpha particle is fired head-on at a nucleus, it decelerates as the electrostatic repulsive force does work against it. At the point of closest approach, all KE has been converted to electric PE:
where q = 2e (alpha charge), Q = Ze (nuclear charge), ε₀ = 8.85 × 10⁻¹² C² J⁻¹ m⁻¹.
This gives an upper limit on the nuclear radius (the alpha stops before reaching the nucleus).
Example for gold (Z = 79): r ≈ 4.55 × 10⁻¹⁴ m. Modern measurements give ~6.5 fm.
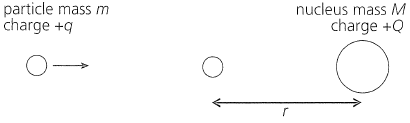
Fig 5.1 — Closest approach
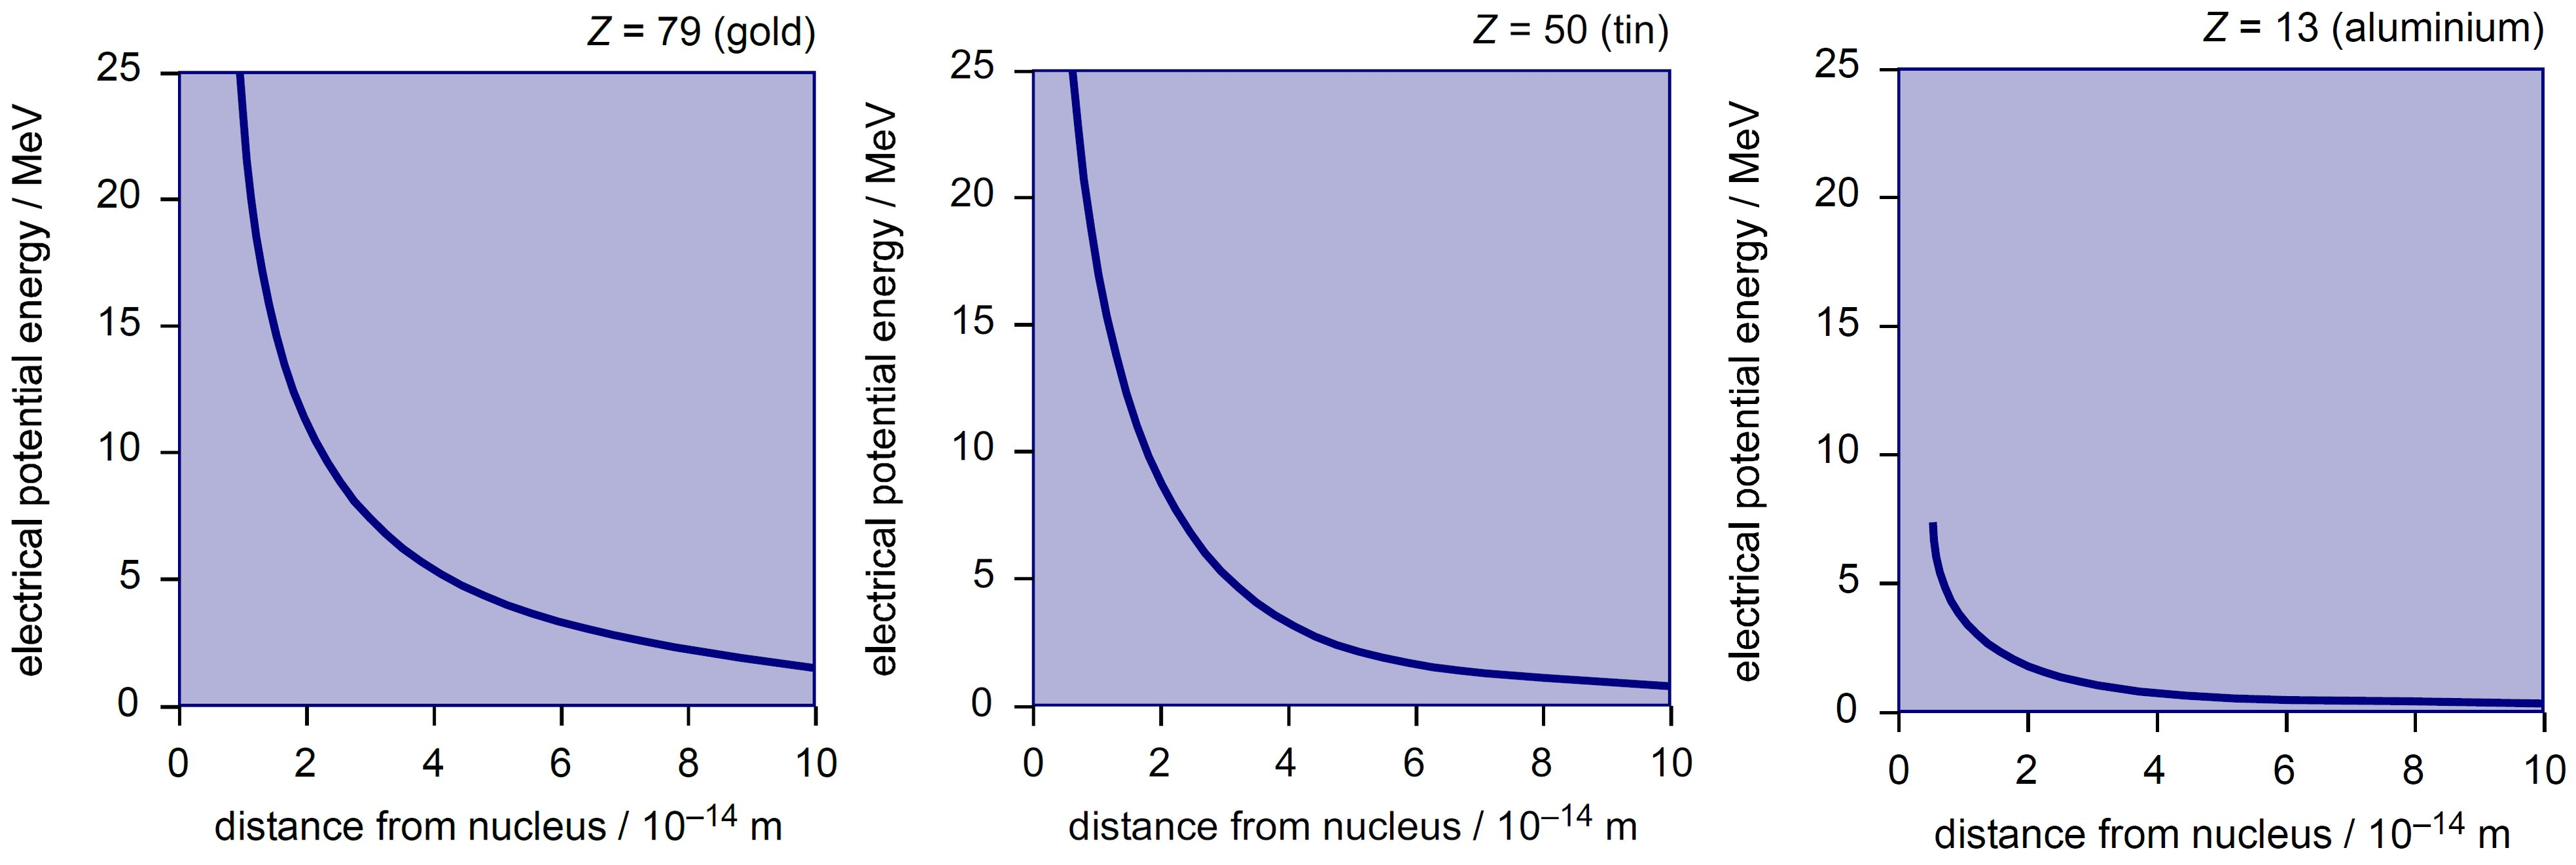
Fig 5.2 — Electric PE vs distance (Au, Sn, Al)
High-energy electrons (hundreds of MeV) are diffracted by atomic nuclei. The de Broglie wavelength must be comparable to nuclear diameters (~few fm) for diffraction to reveal nuclear structure.
de Broglie wavelength (relativistic electrons, p = E/c approximation):
First diffraction minimum — gives nuclear diameter D:
Electrons at 400 MeV have λ ≈ 3 × 10⁻¹⁵ m — comparable to nuclear diameters, giving finer resolution than X-rays for nuclear-scale features.
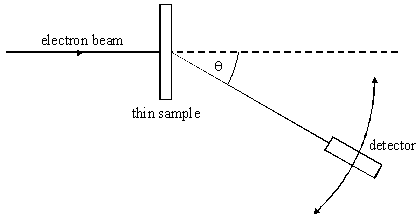
Fig 5.3 — Electron intensity vs angle
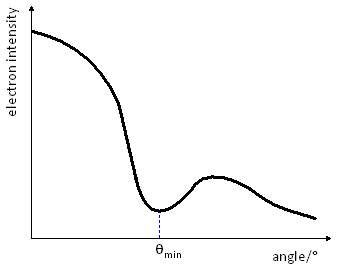
Fig 5.4 — Electron diffraction setup
Plotting nuclear radius R vs A1/3 gives a straight line through the origin, showing:
Nuclear density — the A cancels out, giving the same value for all nuclei:
This is ~10¹⁴ × denser than ordinary matter (~10³ kg m⁻³), confirming atoms are almost entirely empty space.
Constant density implies the strong nuclear force is saturated — each nucleon interacts only with its nearest neighbours, not all others. Volume ∝ A.
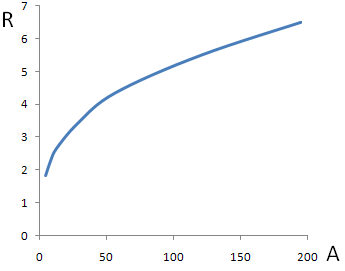
Fig 5.5 — R vs A (curve)
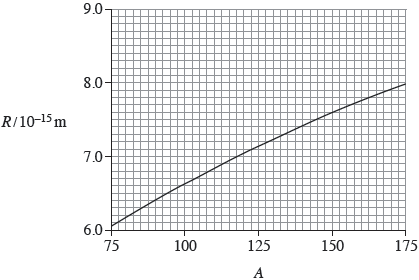
Fig 5.6 — R vs A1/3 (linear)
Prerequisite knowledge: Einstein's E = mc²; atomic mass units (u); nuclear notation; concept of binding energy
The mass of a nucleus is always less than the total mass of its separated protons and neutrons. This difference is the mass defect Δm:
Example — Helium-4 (2p + 2n): Mass of nucleons = 6.696 × 10⁻²⁷ kg; Mass of nucleus = 6.648 × 10⁻²⁷ kg; Δm = 0.029 u
| Particle | Mass (kg) | Mass (u) |
|---|---|---|
| Proton | 1.673 × 10⁻²⁷ | 1.00728 |
| Neutron | 1.675 × 10⁻²⁷ | 1.00867 |
| Electron | 9.11 × 10⁻³¹ | 0.00055 |
1 atomic mass unit: 1 u = 1.661 × 10⁻²⁷ kg
Einstein's mass-energy equivalence:
The binding energy of a nucleus is the energy required to completely separate it into its constituent protons and neutrons. It equals the mass defect times c²:
The mass defect arises because energy is released when nucleons bind together (strong force pulls them into a lower energy state). The 'missing' mass has been converted to this released energy.
Convenient unit: 1 u = 931.3 MeV/c² (i.e. 1 u of mass defect ≡ 931.3 MeV of binding energy)
Example — Helium-4: Δm = 0.029 u → EB = 0.029 × 931.3 = 27 MeV
The graph of binding energy per nucleon vs nucleon number A is one of the most important in nuclear physics:
A higher binding energy per nucleon means more energy is needed to remove a nucleon → more stable.
Fusion: Light nuclei (A < 56) fusing release energy — products have higher BE/nucleon than reactants.
Fission: Heavy nuclei (A > 56) splitting release energy — fragments have higher BE/nucleon than the parent.
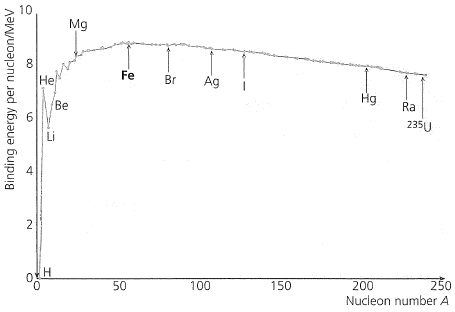
Fig 6.1 — Binding energy per nucleon vs nucleon number
In Cockcroft and Walton's 1932 experiment, protons (energy 0.8 MeV) bombarded lithium: ¹H + ⁷Li → ⁴He + ⁴He. Masses (u): H = 1.0073, Li = 7.0160, He = 4.0015. 1 u = 931 MeV/c².
The ratio of deuterium (2H) atoms to ordinary hydrogen in water is roughly 1:7000. A litre of water contains about 55.6 moles (H2O molar mass ≈ 18 g mol−1). Deuterium fusion releases about 3.27 MeV per pair of nuclei fused.
Prerequisite knowledge: binding energy per nucleon graph; mass-energy equivalence; nuclear equations with conservation laws; chain reactions
Nuclear fission — a heavy nucleus splits into two smaller daughter nuclei, releasing energy and free neutrons. Typically 2–3 neutrons released per fission, along with ~200 MeV.
Induced fission: A slow (thermal) neutron is absorbed by a fissile nucleus (e.g. U-235, Pu-239). The resulting unstable nucleus splits:
Chain reaction: Free neutrons trigger further fissions, each producing more neutrons — a self-sustaining reaction.
Critical mass: The minimum mass of fissile material needed for a self-sustaining chain reaction.
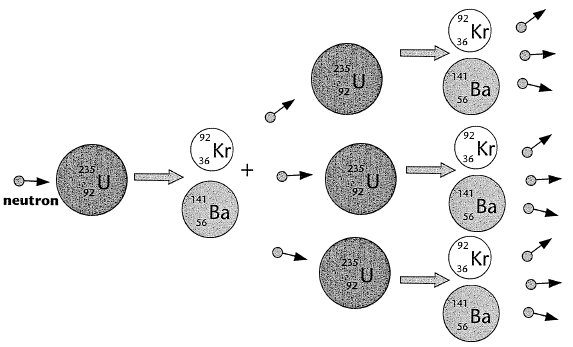
Fig 7.1 — Chain reaction in U-235 fission
Nuclear fusion — two light nuclei combine to form a heavier nucleus, releasing energy.
Nuclei must reach very high kinetic energies (temperatures ~10⁸ K) to overcome the Coulomb barrier (mutual electrostatic repulsion). Once close enough, the strong nuclear force takes over and pulls them together.
Deuterium-tritium fusion (most promising for reactors):
Deuterium-deuterium fusion:
Fusion produces far more energy per kg of fuel than fission, and the fuel (hydrogen isotopes from water) is abundant. Achieving and sustaining the extreme temperatures needed is the major engineering challenge.
Both fission and fusion release energy by increasing the average binding energy per nucleon of the products compared to the reactants.
Energy per nucleon: Fusion releases more energy per nucleon than fission (e.g. H→He gain ~6 MeV/nucleon vs ~1 MeV/nucleon for fission).
Fission fragments are neutron-rich: Heavy nuclei (N >> Z) split into fragments that retain the original high N/Z ratio. These fall above the stability line → likely β⁻ emitters.
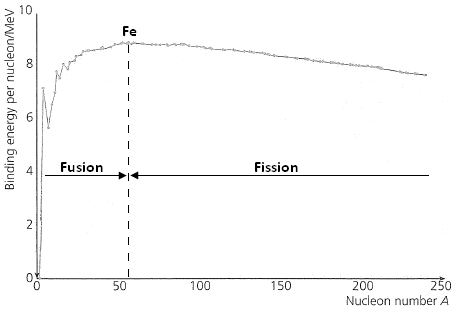
Fig 7.3 — Binding energy per nucleon vs nucleon number
Prerequisite knowledge: fission chain reactions; thermal vs fast neutrons; neutron capture; power and efficiency calculations
A nuclear fission reactor generates heat from controlled nuclear fission. This heat produces steam to drive turbines connected to electrical generators.
Fuel Rods: Made from enriched uranium (higher proportion of U-235 than natural uranium). Natural uranium is 99.28% U-238 and only 0.72% U-235.
Moderator: Fission neutrons are released at ~10⁷ m s⁻¹ — too fast for U-235 to capture. The moderator slows them to thermal speeds (~2×10³ m s⁻¹) through repeated collisions.
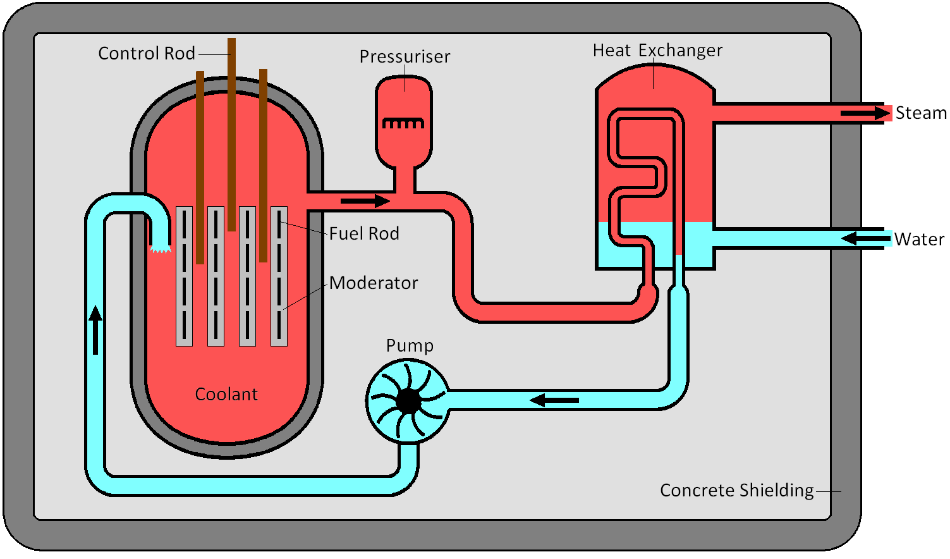
Fig 8.1 — Pressurised water reactor schematic
Control Rods: Absorb excess neutrons to control the rate of fission and the power output. Each fission produces 2–3 neutrons but only 1 is needed to sustain the chain reaction.
Coolant: Carries heat from the reactor core to the heat exchanger. Hot coolant transfers heat to a secondary water circuit, producing steam to drive turbines.
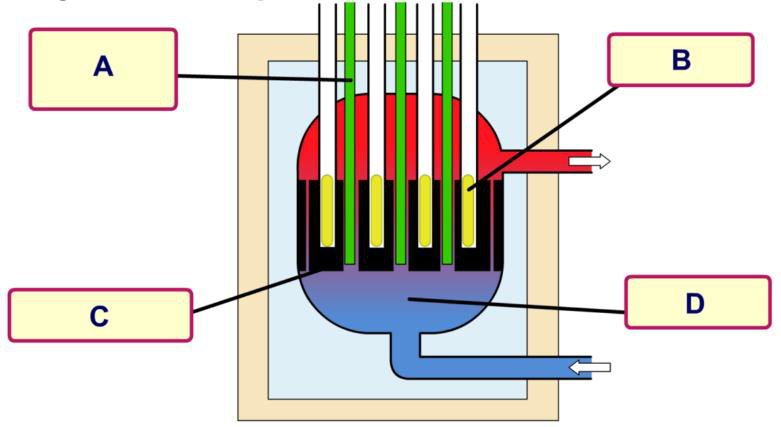
Fig 8.2 — Label reactor components (A–D)
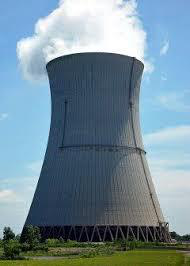
Fig 8.3 — Cooling towers
In normal operation the reactor is maintained at criticality: exactly 1 neutron per fission event causes another fission (multiplication factor k = 1).
Not all produced neutrons cause fission: some escape through the surface, some are absorbed by U-238, some by the moderator or coolant, some travel too fast.
Emergency shut-down (SCRAM): Control rods are immediately fully inserted into the core, absorbing all available neutrons and stopping fission. Secondary control rods held by electromagnets drop automatically on power failure.
After shut-down: Fuel rods continue to produce heat from decay of radioactive fission products. Emergency cooling is essential even after the reactor is off.
Neutron activation: Neutrons escaping the core can be absorbed by shielding nuclei, making them unstable (radioactive). This is why shielding becomes radioactive over time.
Prerequisite knowledge: half-life and activity calculations; reactor components and their roles; radioactive decay and decay heat; properties of ionising radiation
Nuclear reactors require multiple overlapping safety systems.
Fuel Design: Solid fuel rods reduce risk of spills. Remote-controlled handling eliminates direct human contact.
Reactor Shielding:
Emergency Shut-Down (SCRAM):
Radioactive waste is classified into three levels depending on its radioactivity and half-life:
| Level | What it is | Disposal method | Time scale |
|---|---|---|---|
| High-Level | Spent fuel rods; reprocessing waste | Cooling ponds → steel containers → glass blocks → deep underground storage | Dangerous for thousands of years |
| Intermediate-Level | Fuel cladding; contaminated equipment; hospital radioisotopes | Steel drums encased in concrete; deep underground storage | Thousands of years |
| Low-Level | Lab equipment; protective clothing; cooling pond water | Sealed metal drums; buried in supervised repositories; treated water released | A few months |
This section brings together concepts from across the nuclear physics topic. Key reminders:
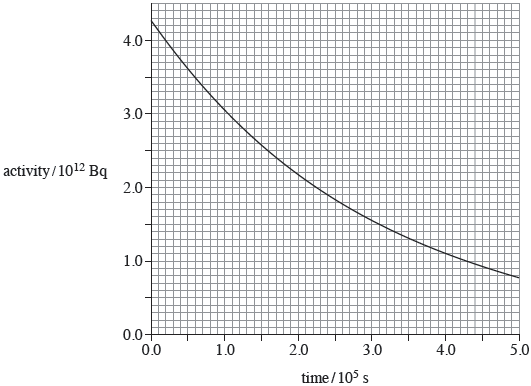
Fig 9.1 — Activity vs time for neptunium-239